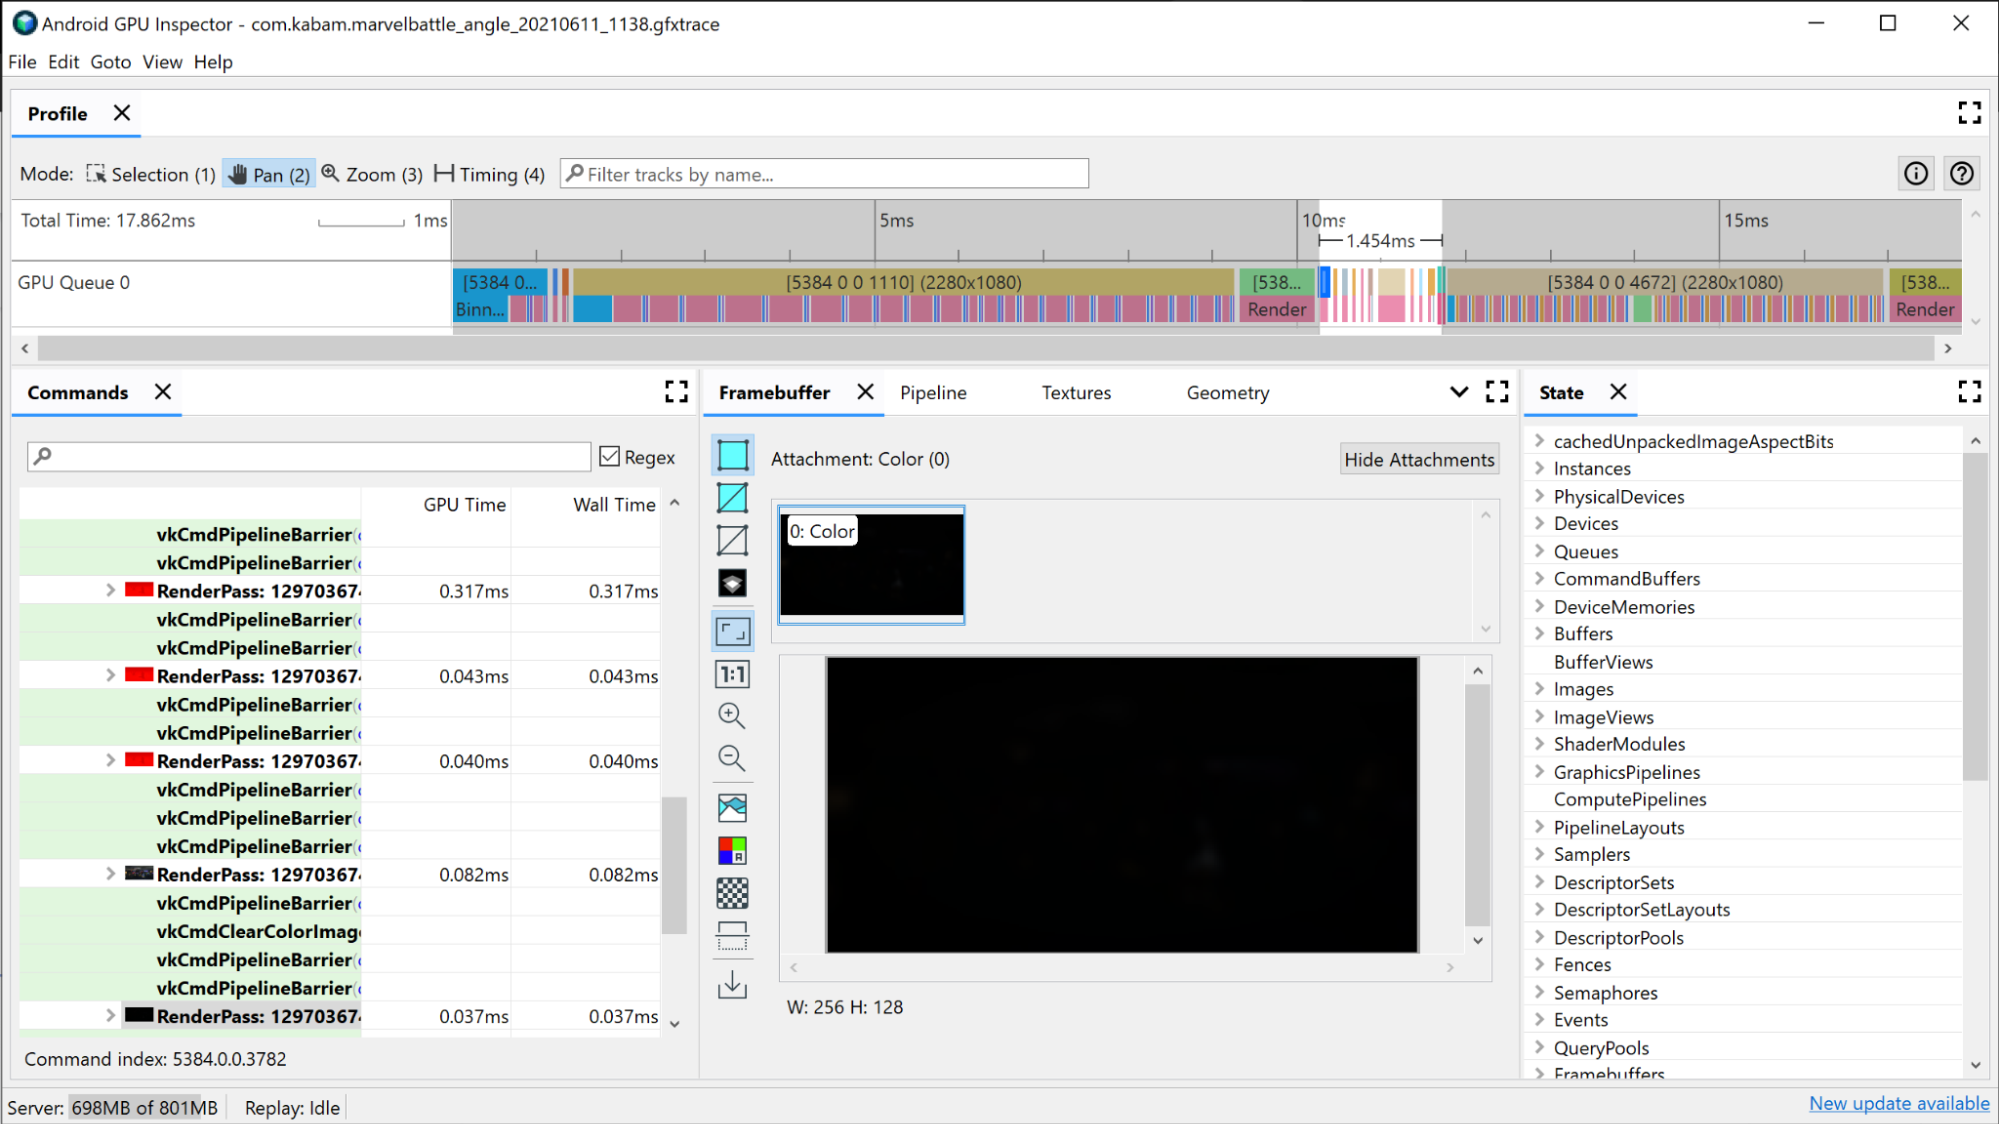
The AGI Frame Profiler lets you examine individual render passes that are used to compose a single frame of your app. It does this by intercepting and recording all the state necessary for executing each graphics API call. On Vulkan this is done natively using Vulkan’s layering system. On OpenGL, commands are intercepted using ANGLE, which converts OpenGL commands to Vulkan calls so that they can be executed on the hardware.
Adreno devices
To identify your expensive render passes, first look at AGI’s timeline view at the top of the window. This shows all the render passes that comprise the composition of a given frame chronologically. It’s the same view that you would see in the System Profiler if you had GPU Queue information. It also presents basic information about the render pass, such as the resolution of the framebuffers being rendered to, which can provide some insight into what’s happening in the render pass itself.
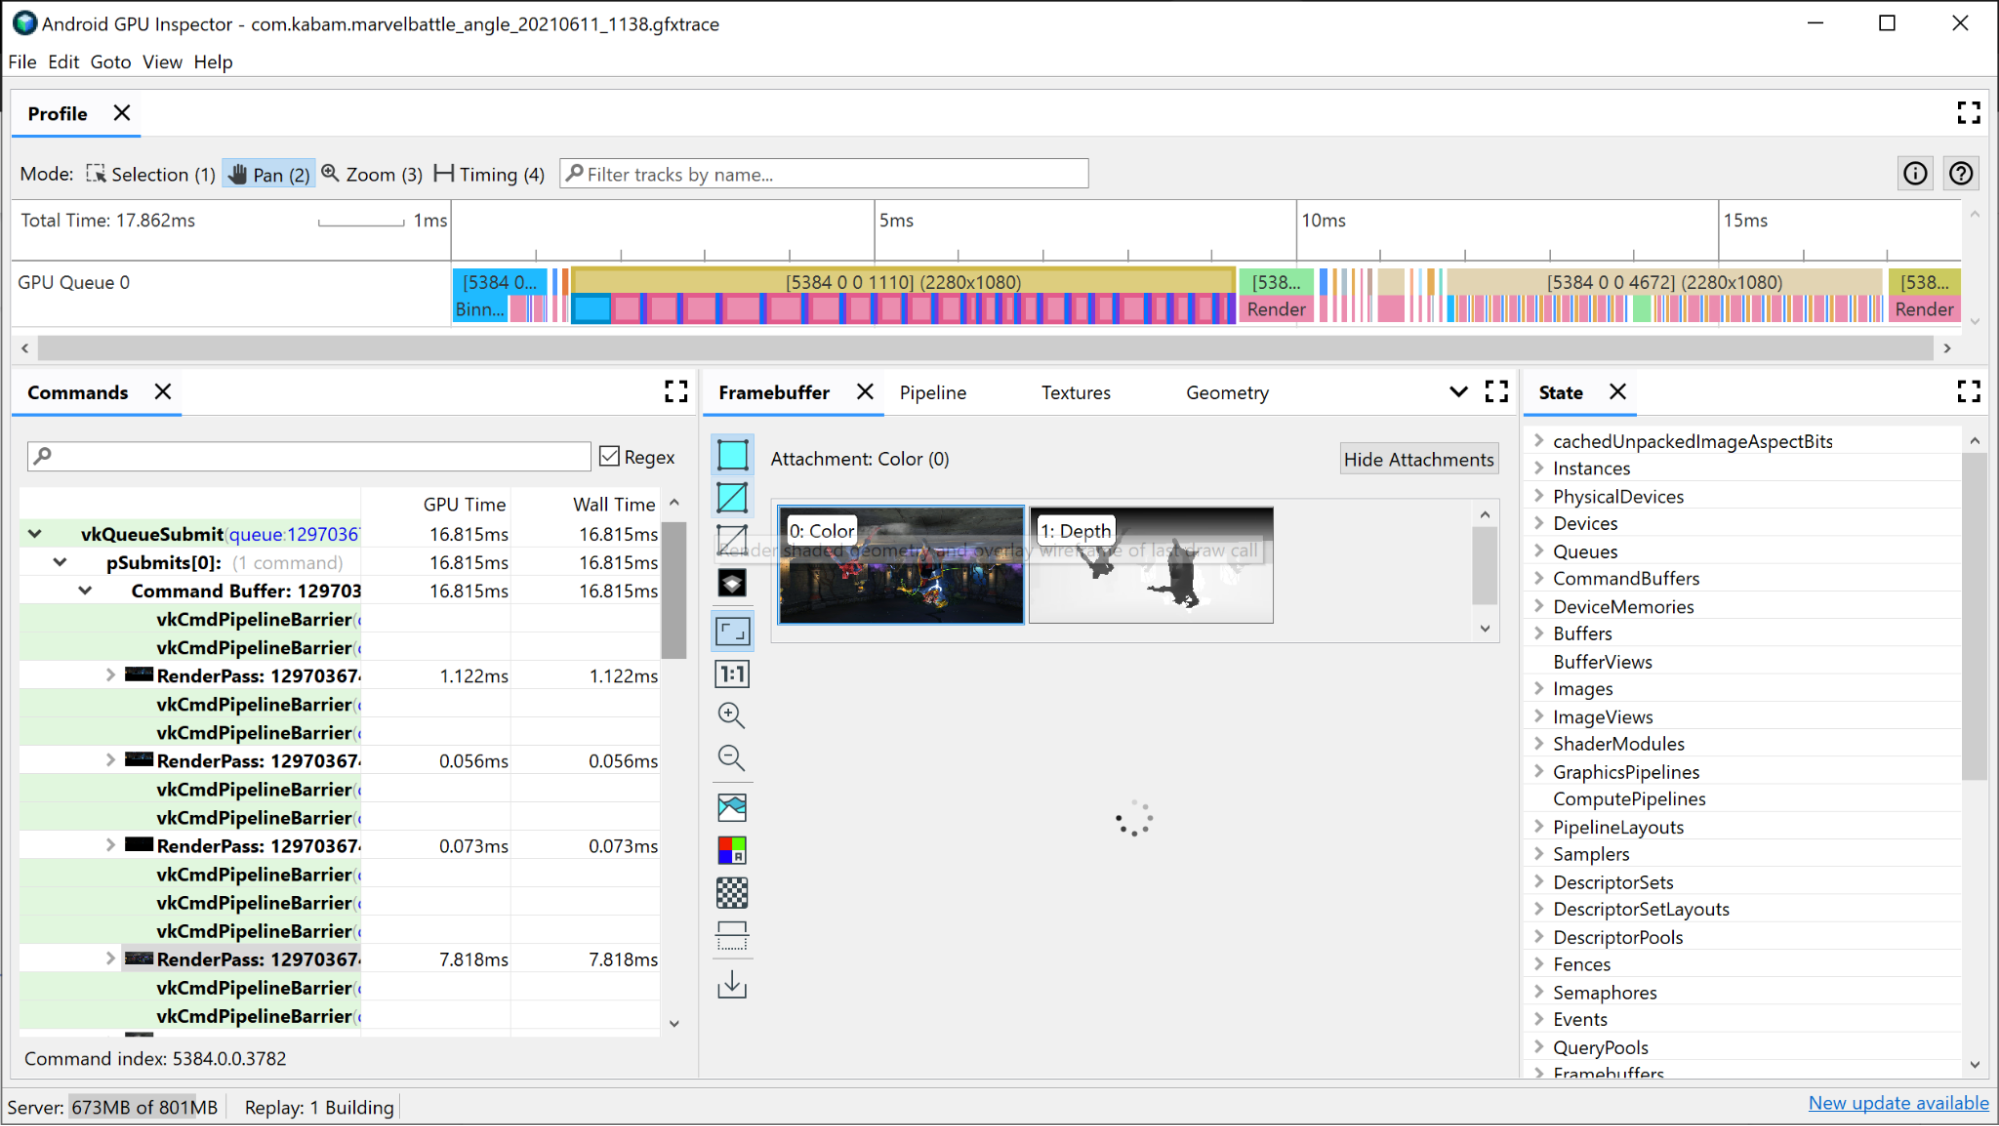
The first criteria you can use to investigate your render passes is how much time they are taking. The longest render pass will most likely be the render pass with the largest potential for improvement, so start by taking a look at that one.
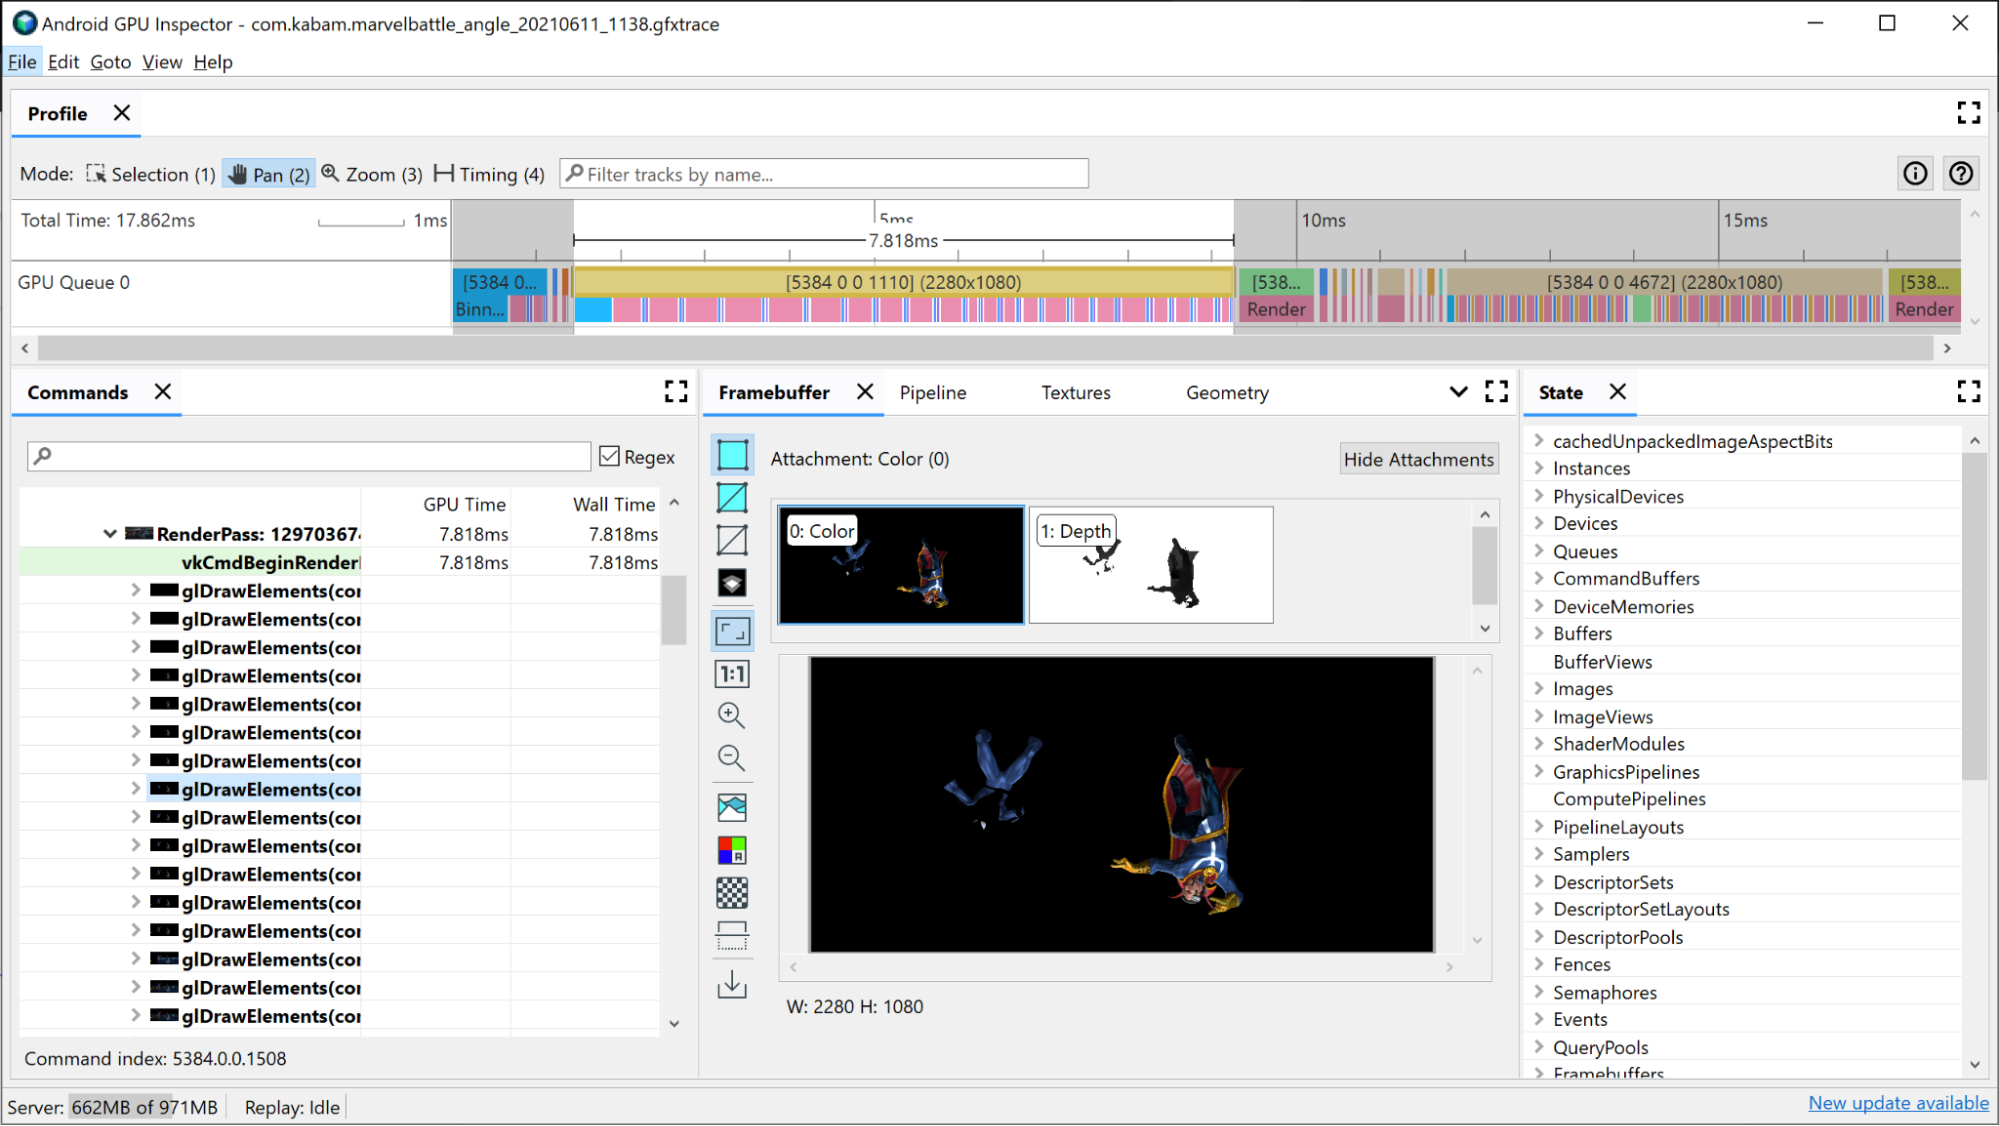
The GPU slice pertaining to the relevant render pass will already present some information on what is happening within the render pass:
- Binning: Where vertices are placed into bins based on where they land on screen
- Rendering: Where pixels or fragments are shaded
- GMEM load/store: When the contents of a framebuffer are loaded or stored from internal GPU memory to main memory
You can get a good idea of where potential bottlenecks may be by looking at how much time each of these takes within the render pass. For example:
- If Binning takes up a large portion of time, this suggests a bottleneck with vertex data which suggests too many vertices, large vertices, or other issues related to vertices.
- If Rendering takes up a majority of time, this suggests that shading is the bottleneck. Possible causes may be complex shaders, too many texture fetches, rendering to a high resolution framebuffer when it’s not necessary, or other related issues.
GMEM loads and stores are also something to keep in mind. It's expensive to move things from graphics memory to main memory, so minimizing the amount of load or store operations will help with performance as well. A common example of this is having a GMEM store depth/stencil, which writes out the depth/stencil buffer to main memory; if you're not using that buffer in future render passes, this store operation can be eliminated and you will save on frame time and memory bandwidth.
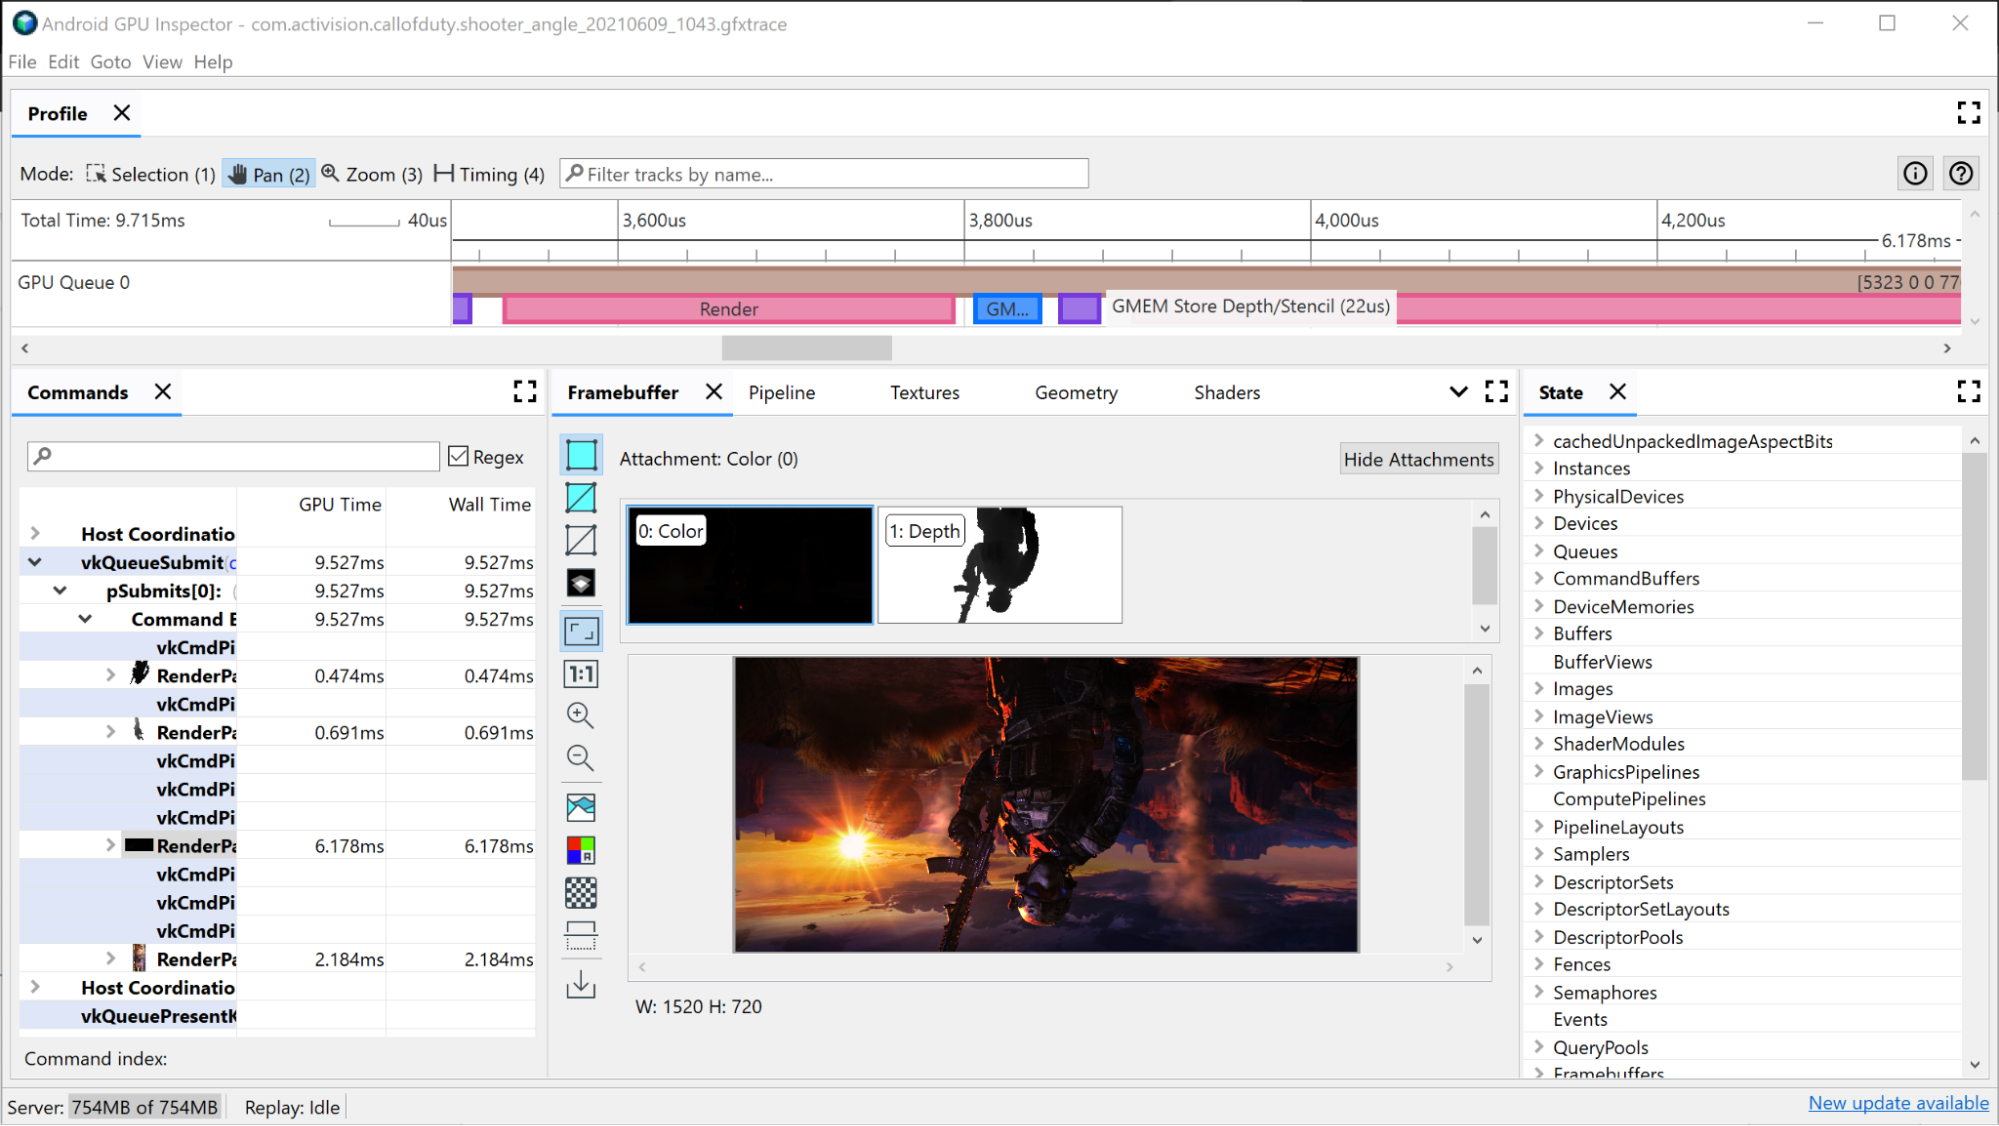
Large render pass investigation
To see all of the individual draw commands issued during the render pass:
Click the render pass in the timeline. This open the render pass in the hierarchy found in the Commands pane of the Frame Profiler.
Click the render pass’s menu, which displays all the individual draw commands issued during the render pass. If this is an OpenGL application, you can dig even further and see the Vulkan commands issued by ANGLE.
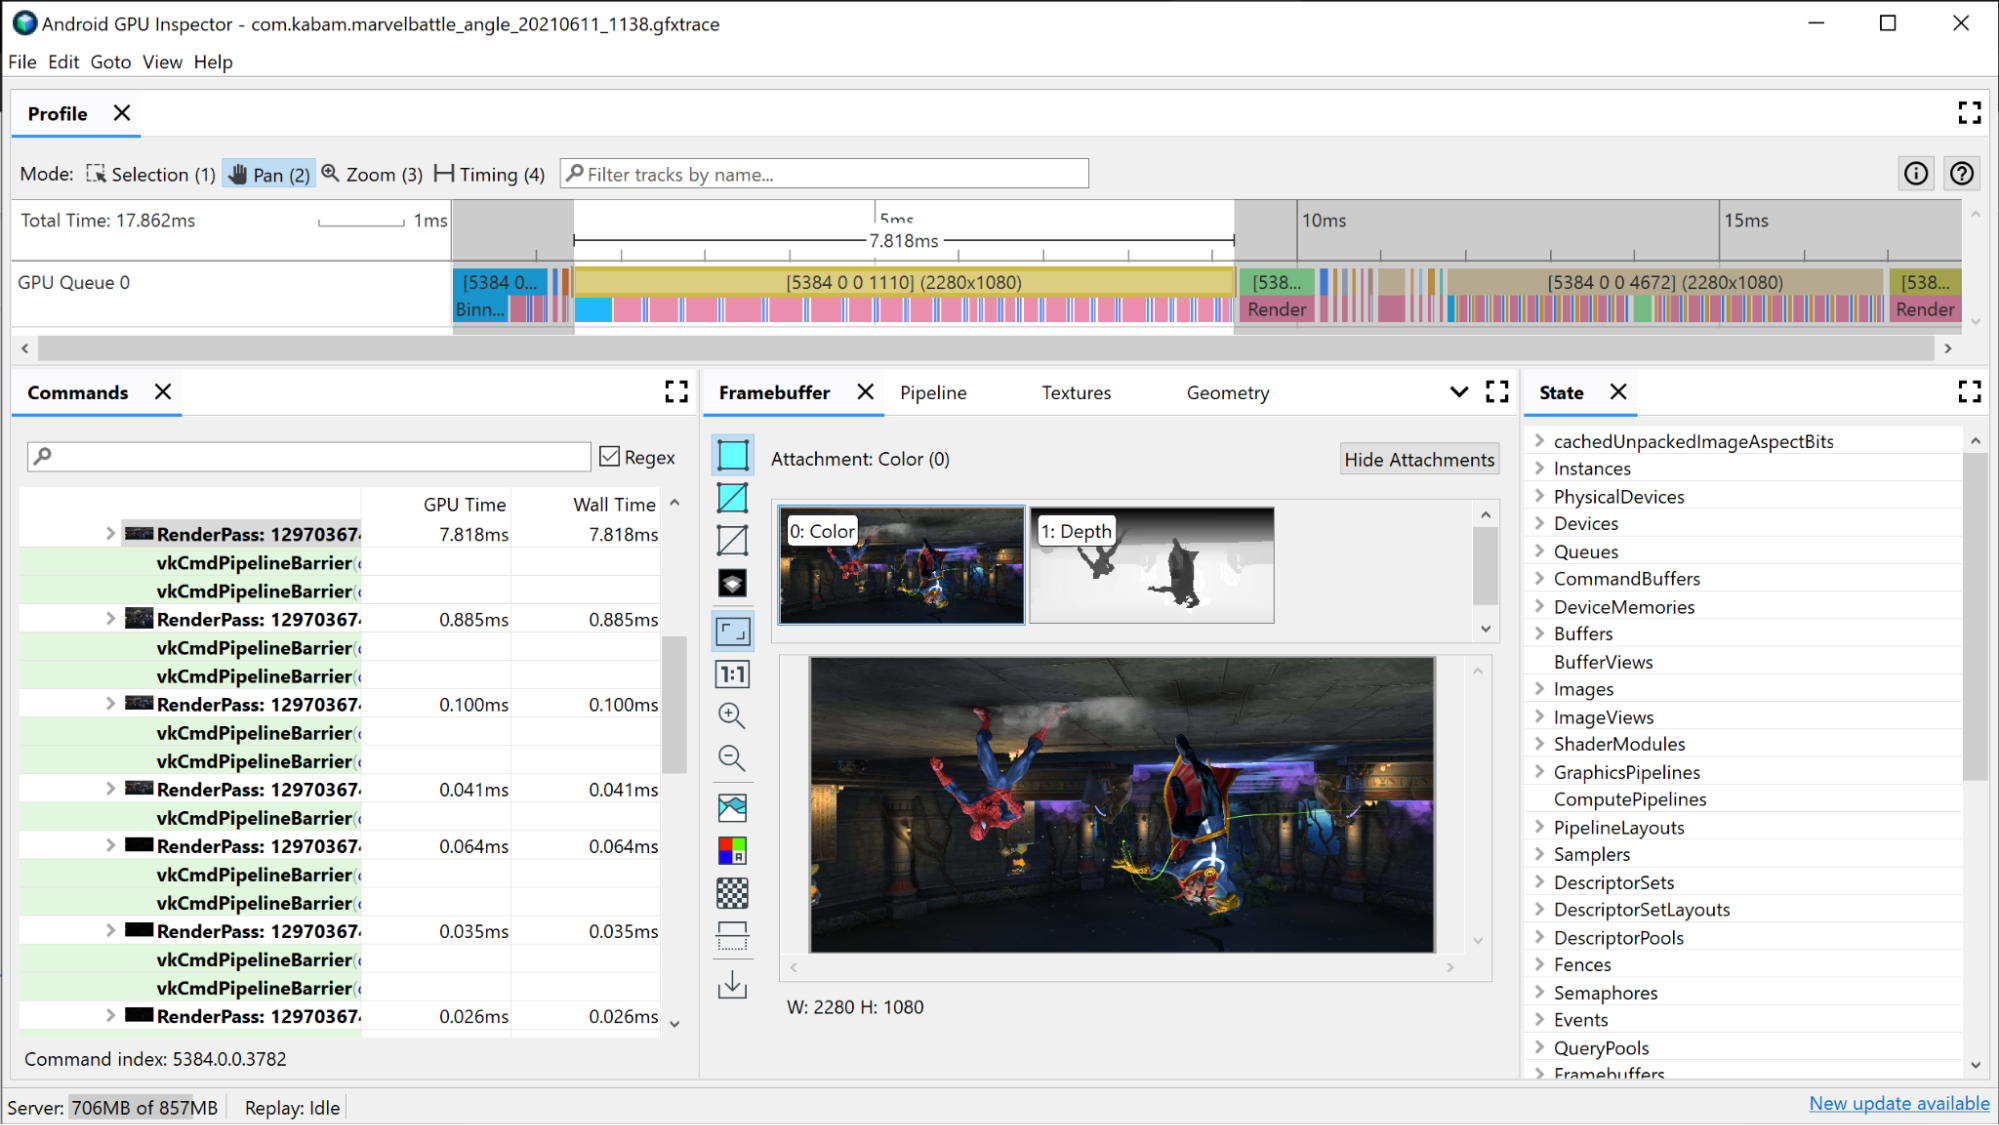
Select one of the draw calls. This opens the Framebuffer pane, which shows all the framebuffer attachments that were bound during this draw, and the final result of the draw on the attached framebuffer. Here you can also use AGI to open both the previous and next draw calls, and compare the difference between the two. If they're visually almost identical, this suggests an opportunity to eliminate a draw call that doesn’t contribute to the final image.

Opening the Pipeline pane for this draw shows the state used by the graphics pipeline to execute this draw call.
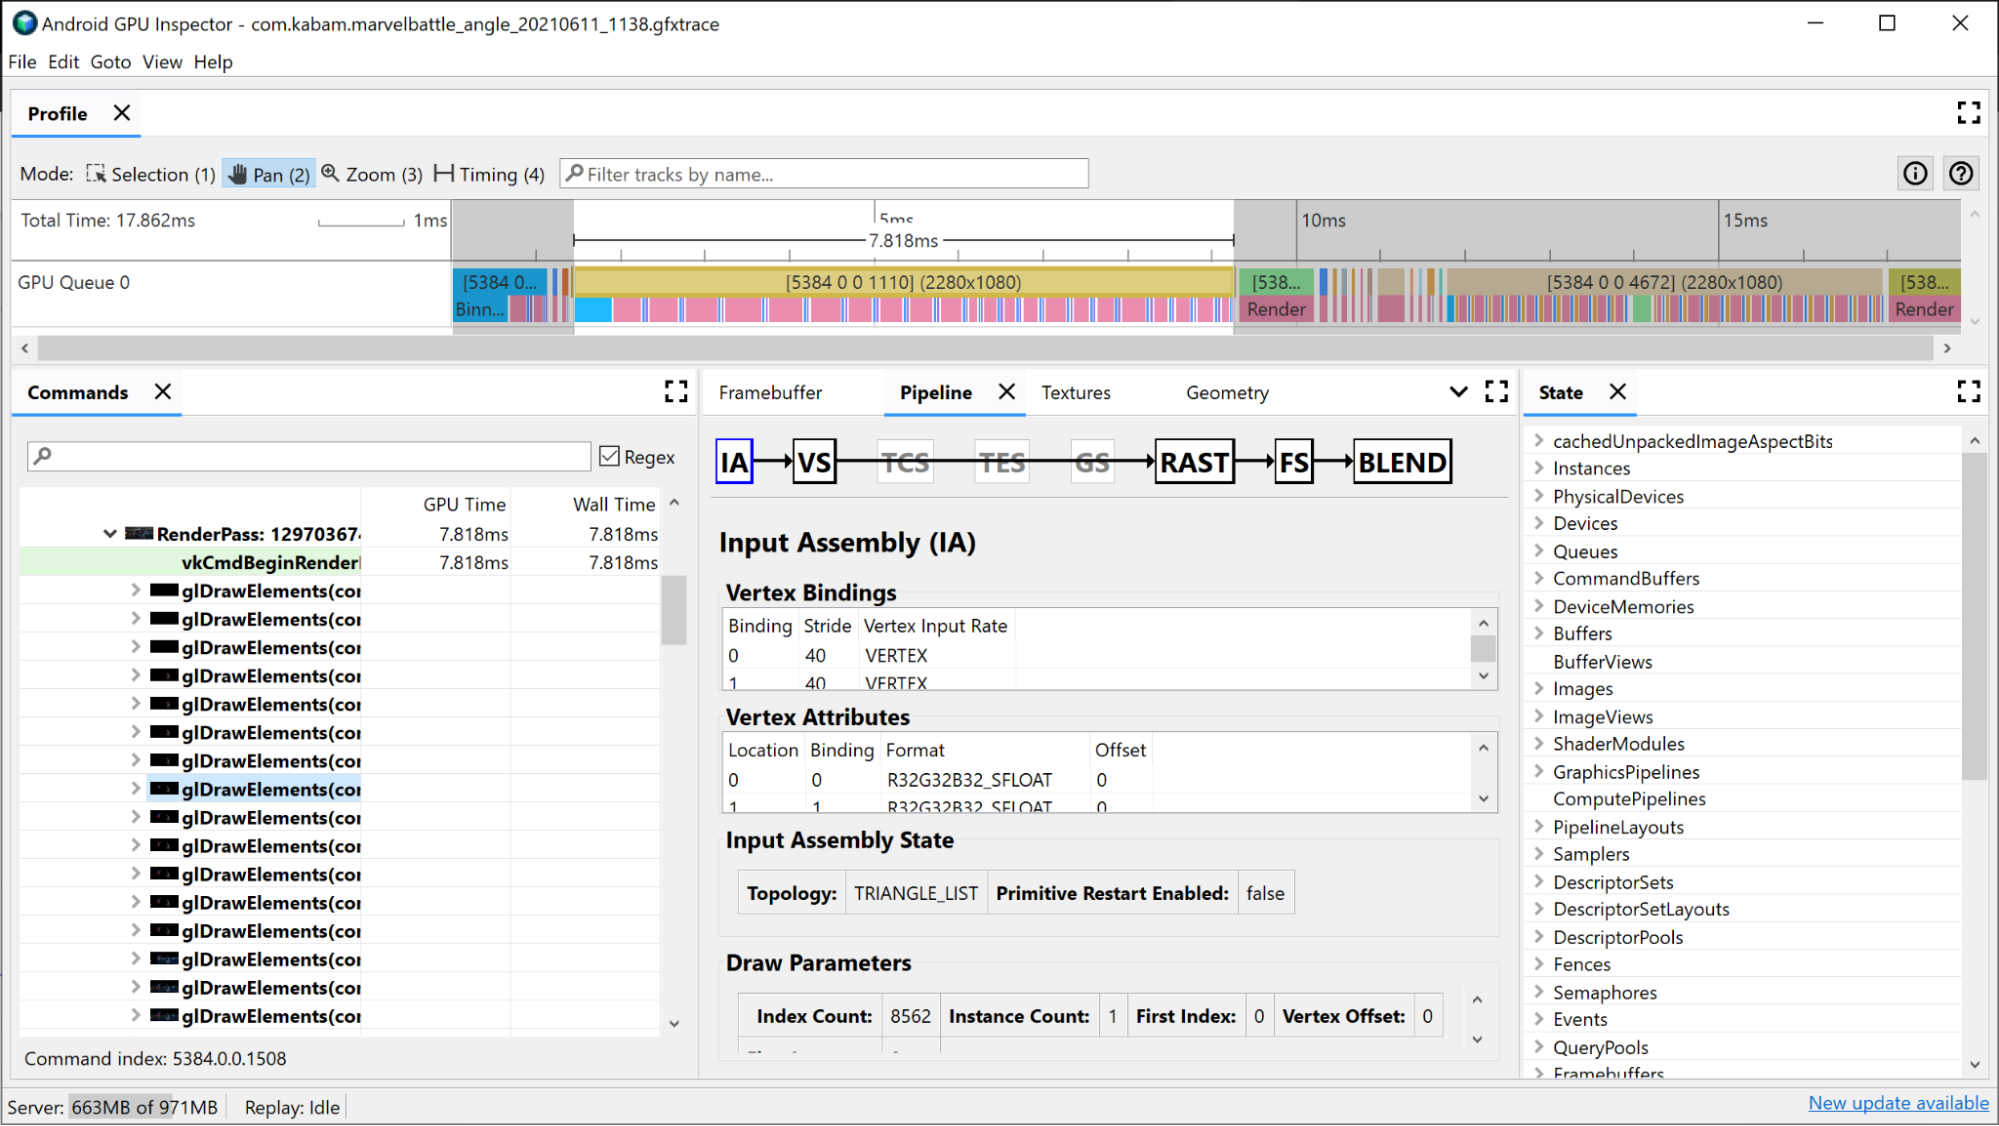
The Input Assembler provides information about how vertex data was bound to this draw. This is a good area to investigate if you noticed that Binning takes up a large portion of your render pass’s time; here you can get information about vertex format, the number of vertices drawn, and how vertices are laid out in memory. For more information on this, see Analyze vertex formats.
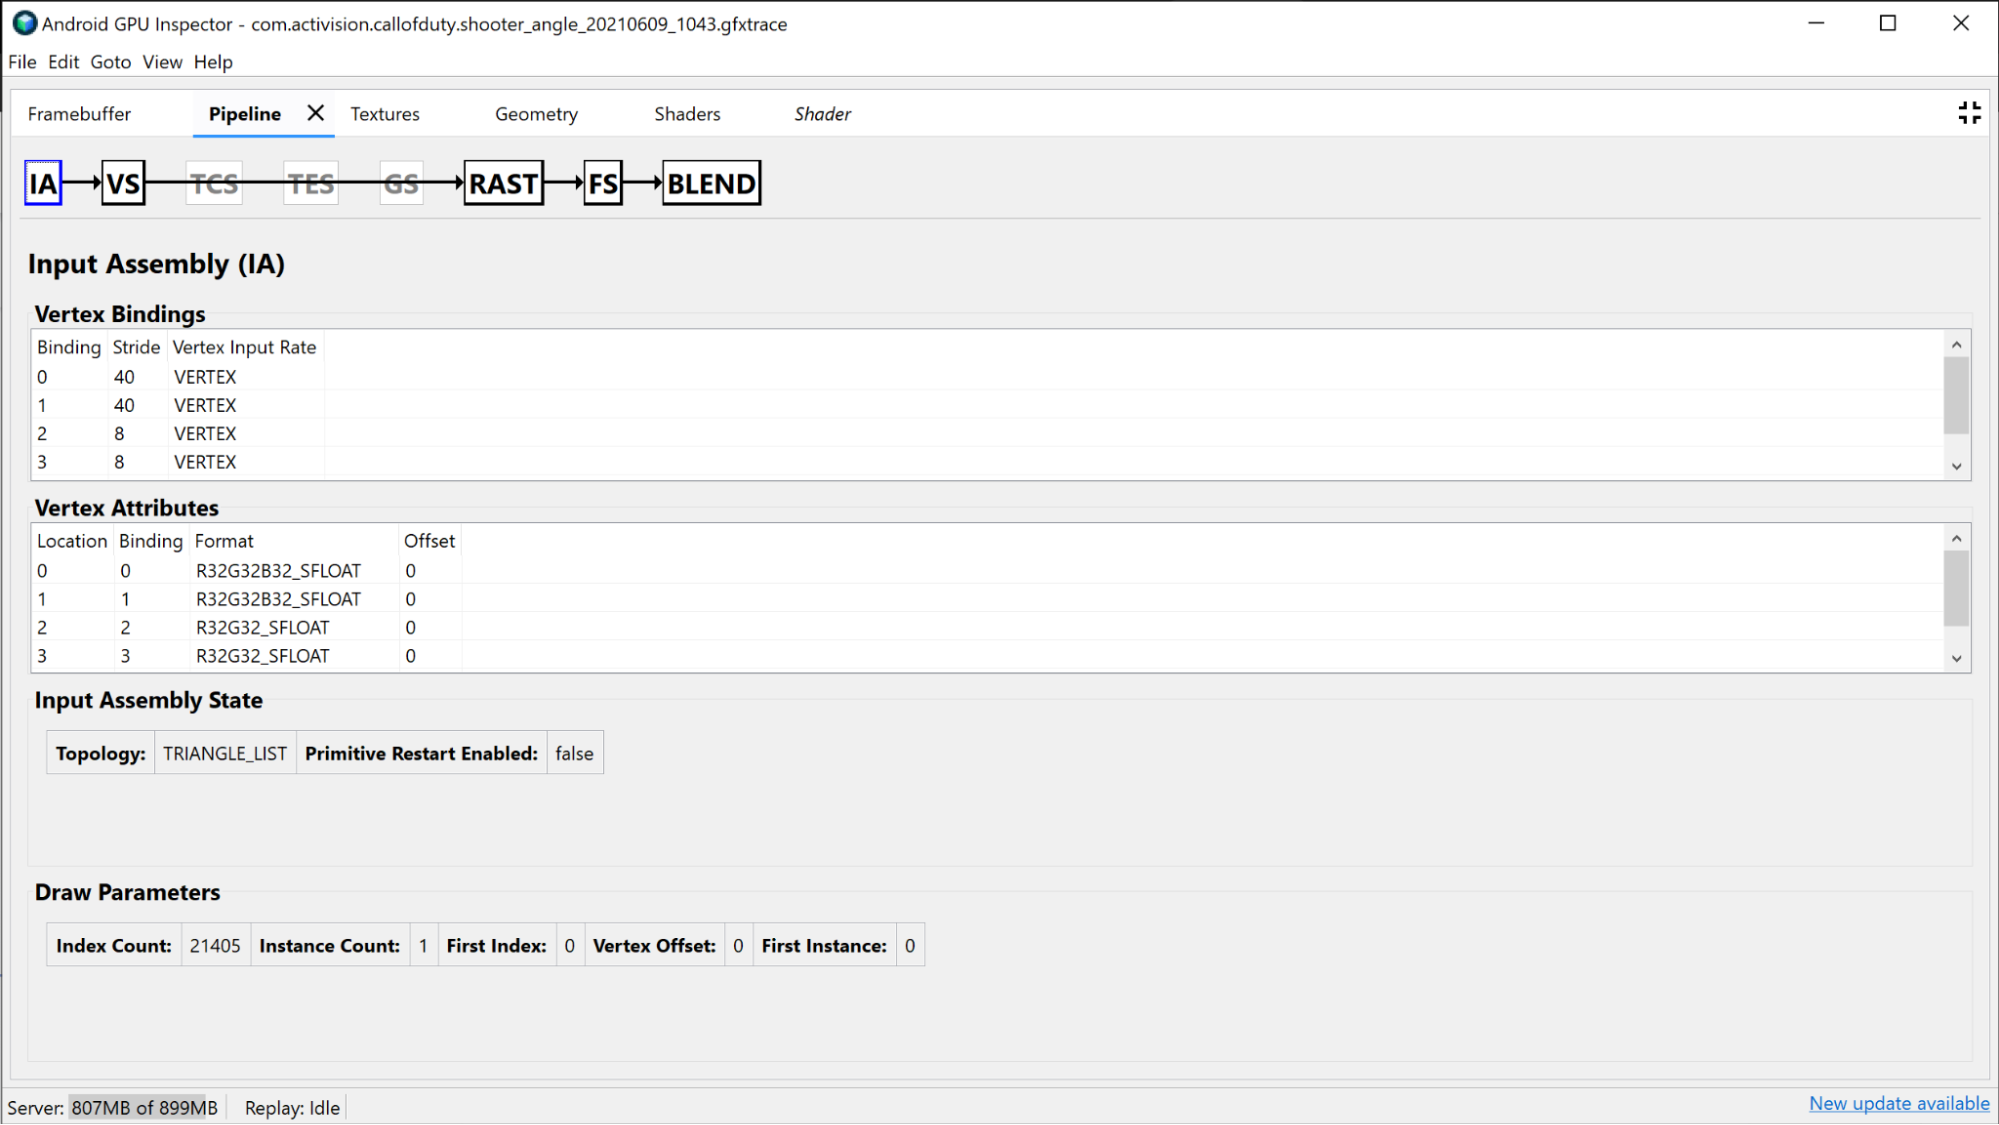
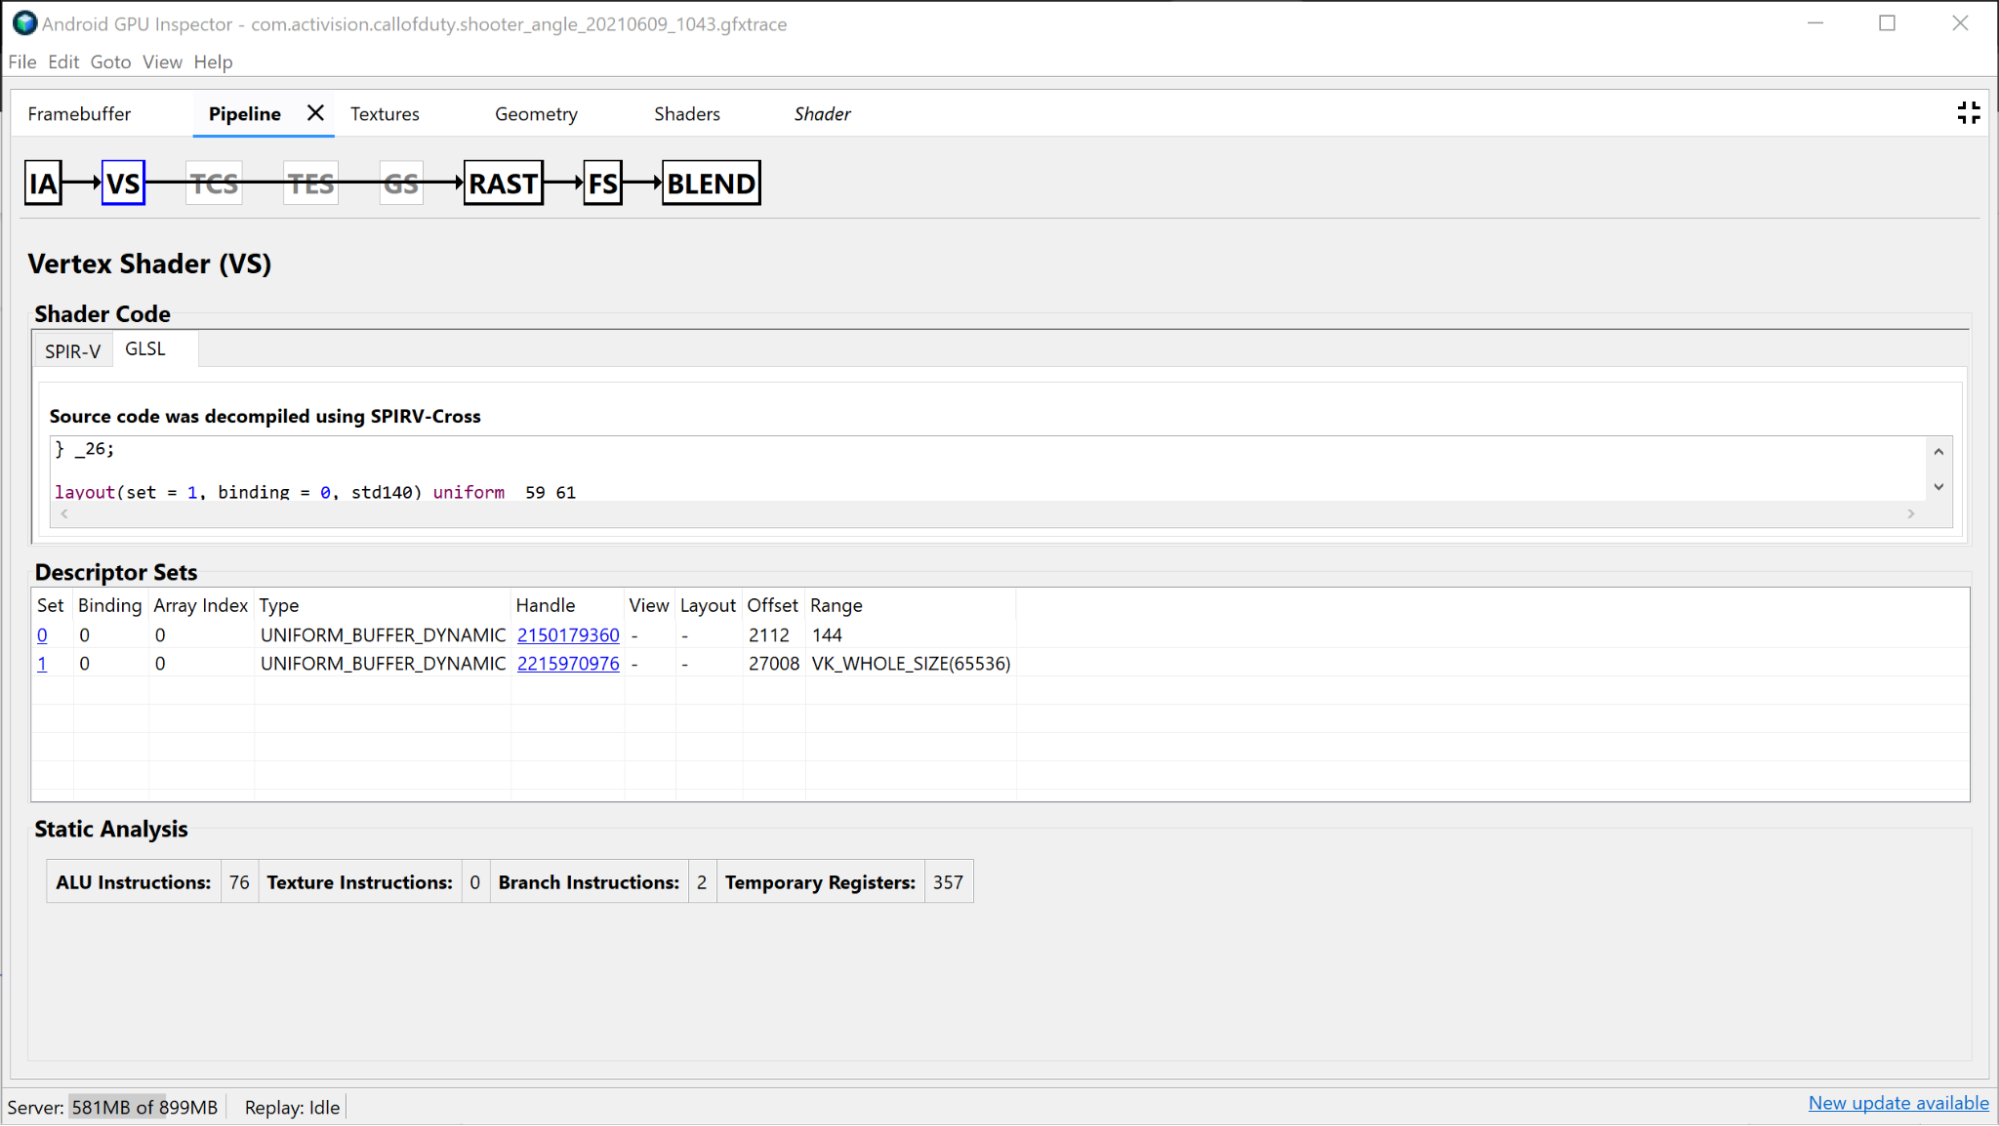
The Vertex Shader section provides information about the vertex shader you used during this draw, and can also be a good place to investigate if binning was identified as an issue. You can see the SPIR-V and decompiled GLSL of the shader used, and investigate the bound Uniform Buffers for this call. See See Analyze shader performance for more details.
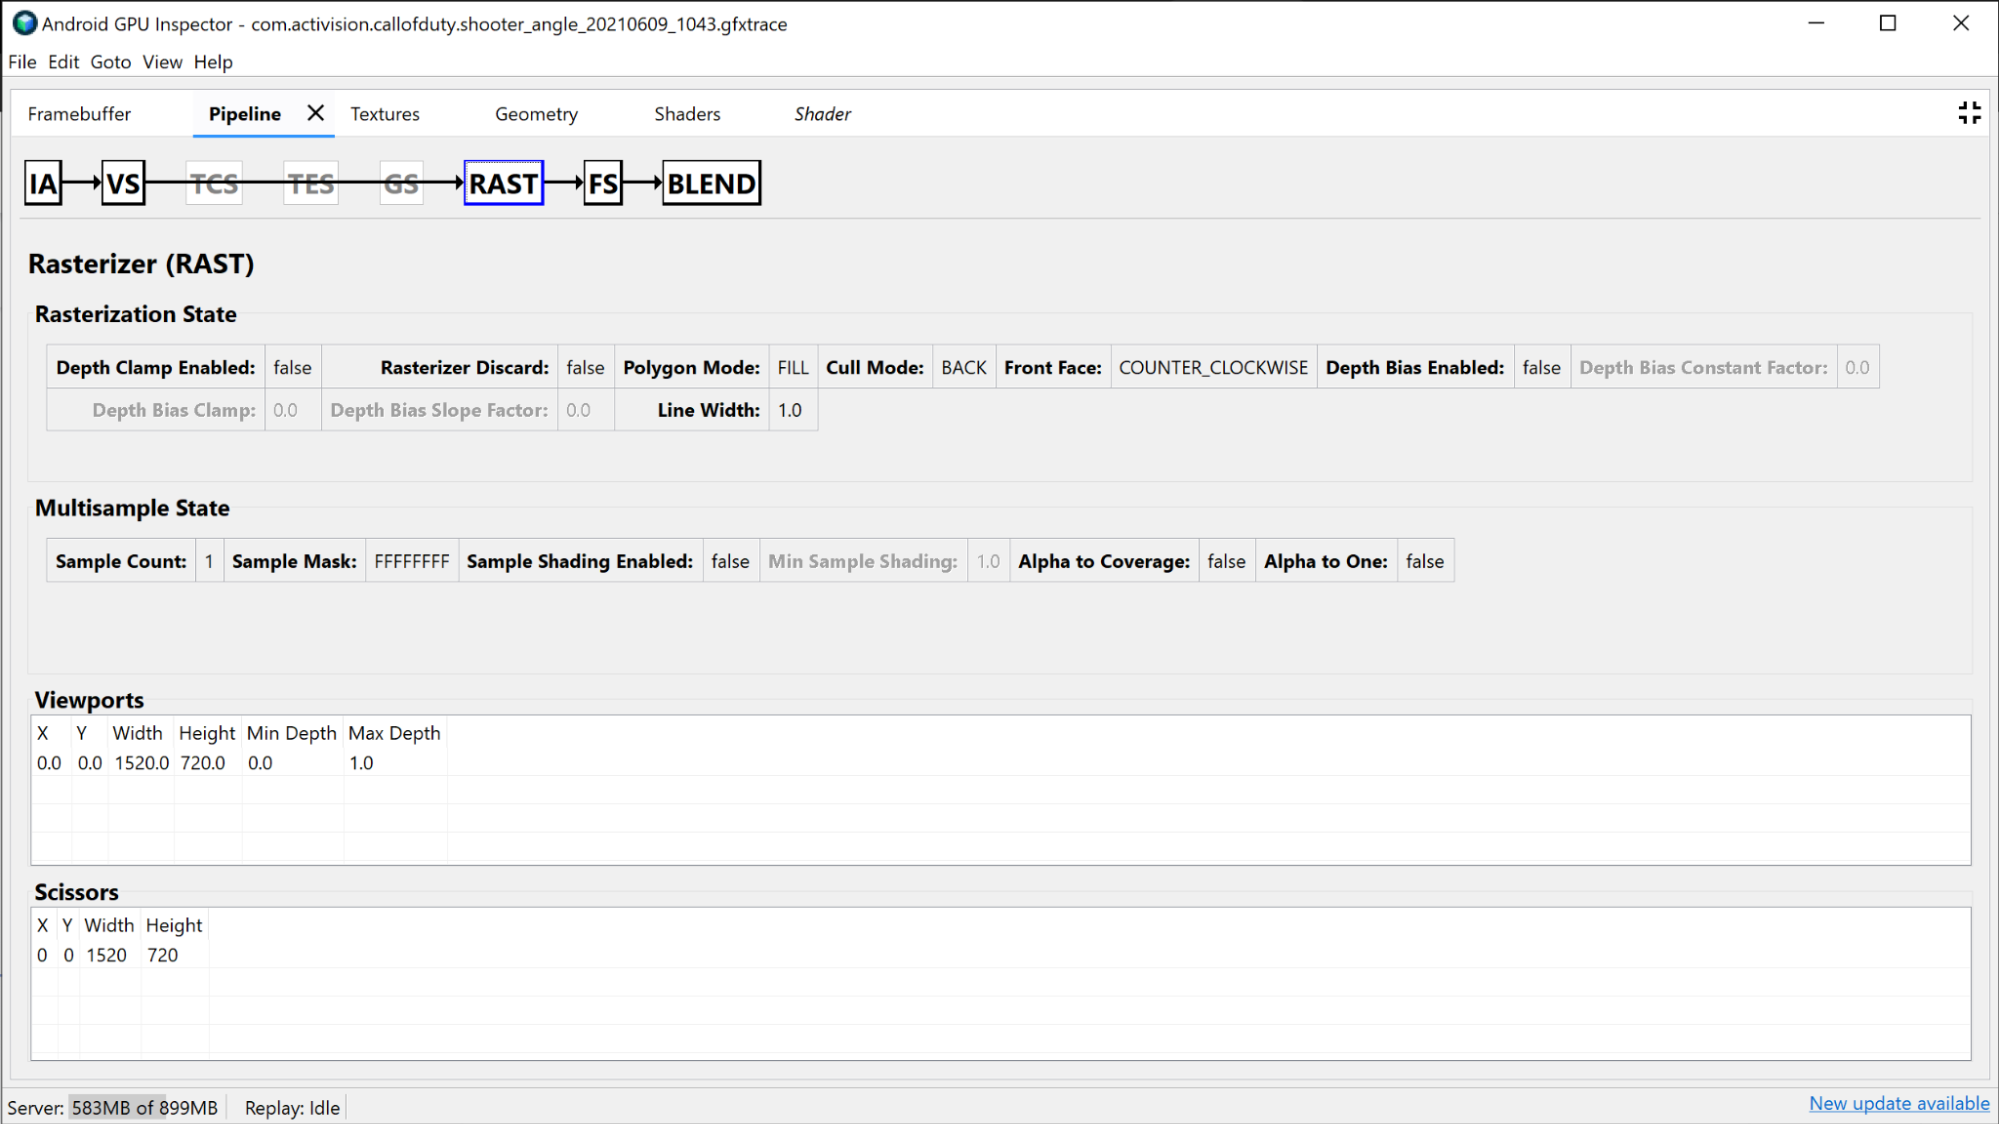
The Rasterizer section shows you information about the more fixed-function setup of the pipeline, and can be used more for debugging purposes of fixed-function state such as viewport, scissor, depth state, and polygon mode.
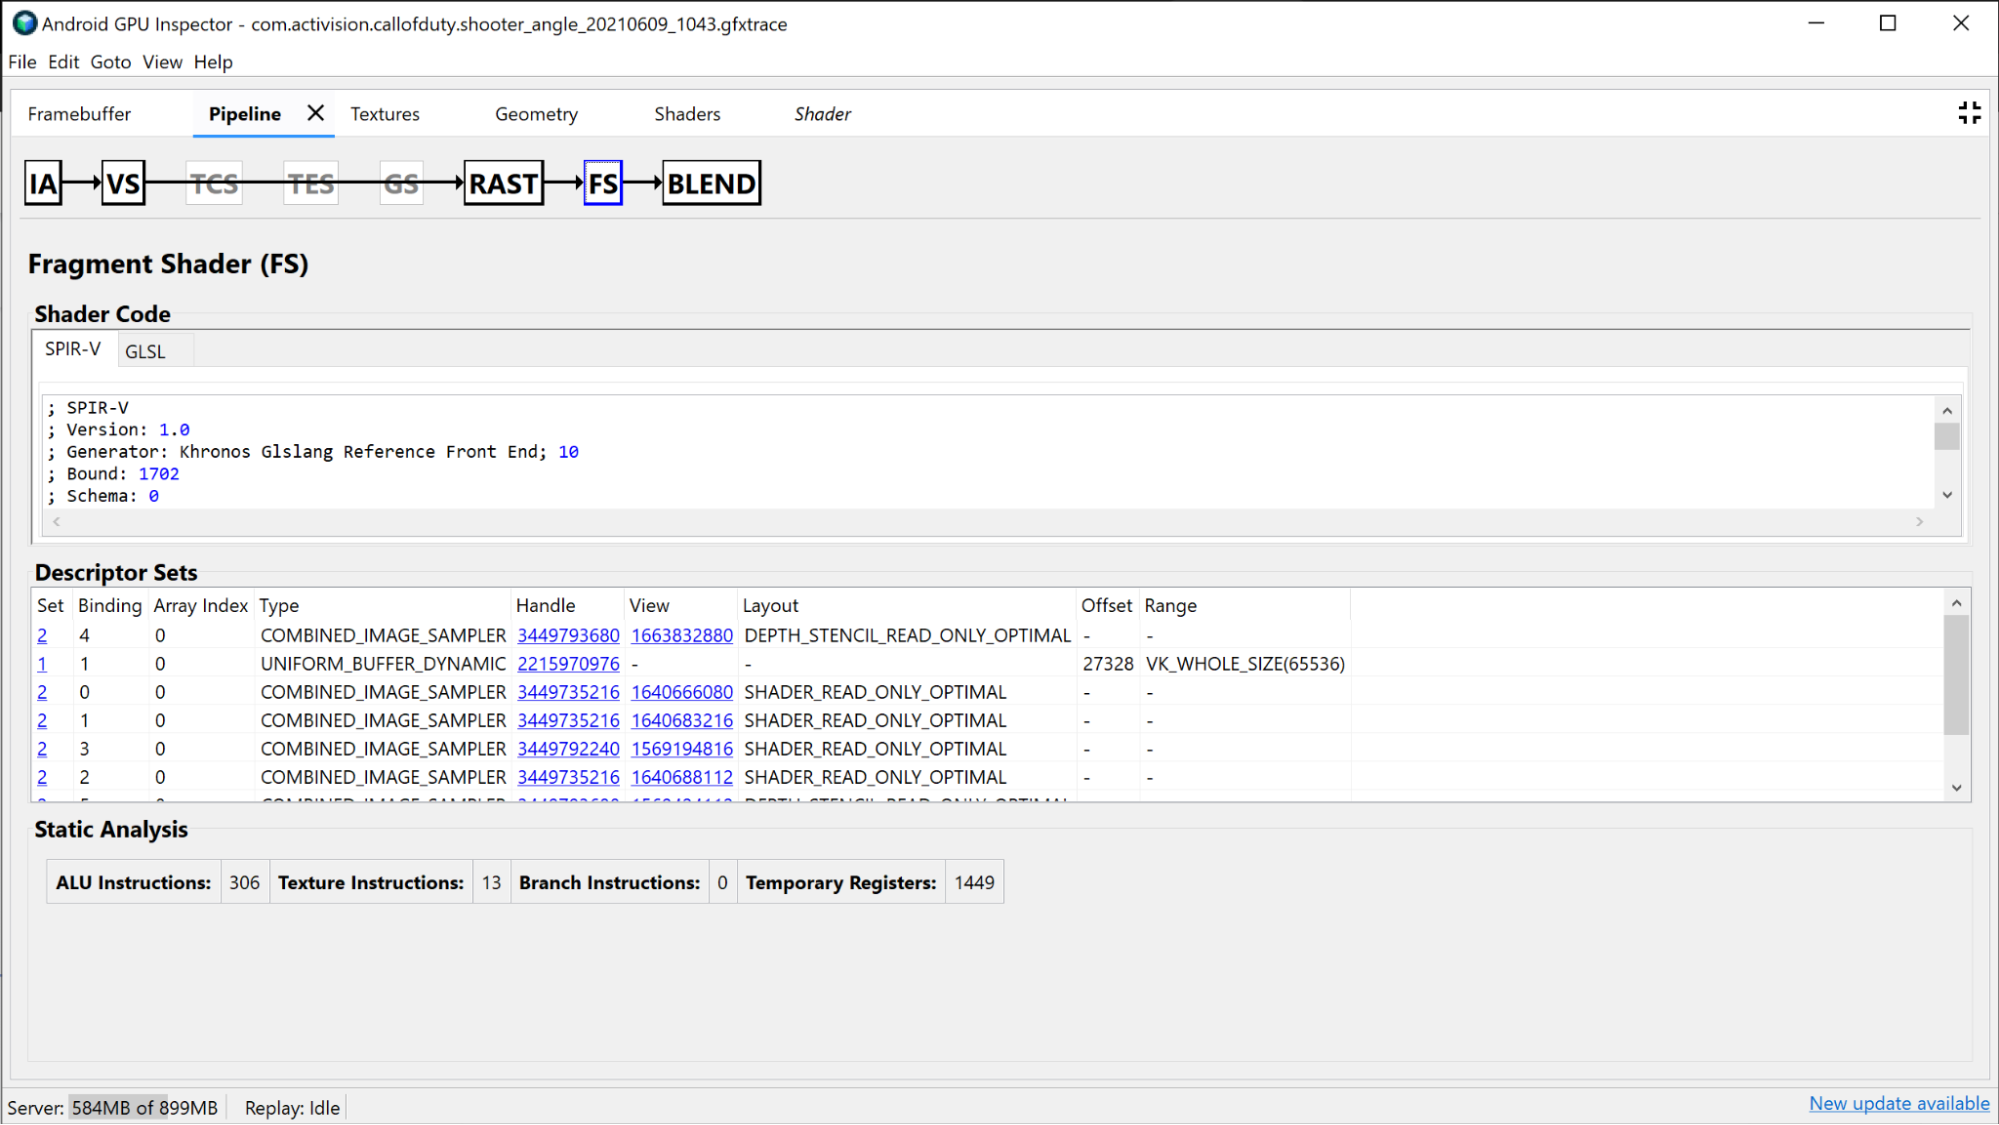
The Fragment Shader section provides a lot of the same information that is found in the Vertex Shader section, but specific to the Fragment Shader. In this case, you can actually see which textures are being bound and investigate them by clicking the handle.
Smaller render pass investigation
Another criteria you can use to improve your GPU performance is looking at groups of smaller render passes. In general you want to minimize the amount of render passes as much as possible, because it takes time for the GPU to update state from one render pass to another. These smaller render passes are usually used to do things like generate shadow maps, apply gaussian blur, estimate luminance, do post processing effects, or render the UI. Some of these can potentially be consolidated into a single render pass, or even eliminated entirely if they do not affect the overall image enough to justify the cost.
