To start recording a trace, choose a recording configuration from either of the dropdown menus above or below the CPU Profiler and click Record.
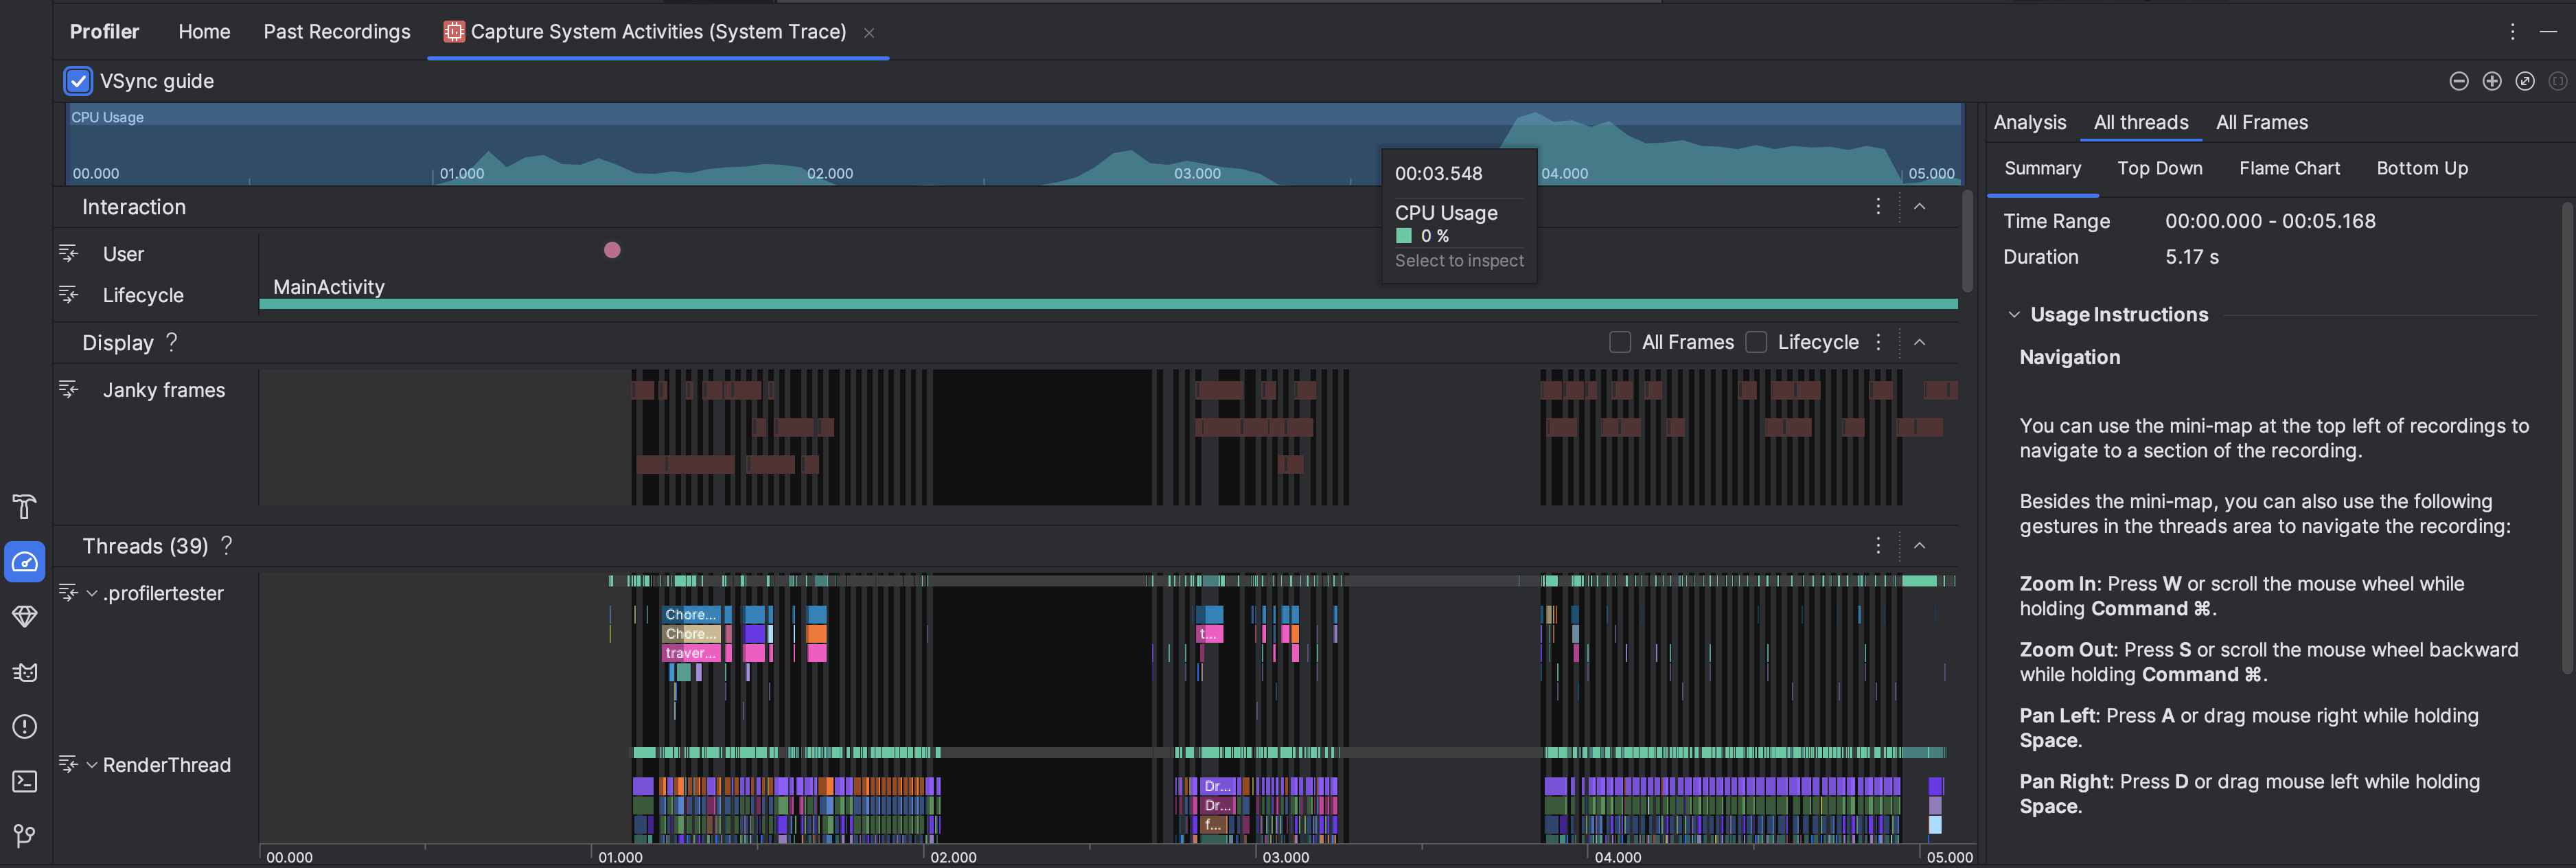
Interact with your app, and then click Stop when you're done. The profiler automatically displays its tracing information in the trace pane, as shown in Figure 2.
- Selected range: Determines the portion of the recorded time to inspect in the trace pane. When you first record a trace, the CPU Profiler automatically selects the entire length of your recording in the CPU timeline. To inspect trace data for only a portion of the recorded time range, drag the edges of the highlighted region.
- Interaction section: Displays user interaction and app lifecycle events along a timeline.
- Threads section: Displays thread state activity (such as running,
sleeping, etc.) and Call Chart (or trace event chart in System Trace)
for every thread along a timeline.
- Use mouse and keyboard shortcuts to navigate the timeline.
- Double-click the thread name or press Enter while a thread is selected to expand or collapse a thread.
- Select a thread to see additional information in the Analysis pane. Hold Shift or Ctrl (Command on Mac) to select multiple threads.
- Select a method call (or trace event in System Trace) to see additional information in the Analysis pane.
- Analysis pane: Displays trace data for the time range and thread or method call you have selected. In this pane, you can select how to view each stack trace (using the analysis tabs) and how to measure execution time (using the time reference dropdown menu).
- Analysis pane tabs: Choose how to display trace details. For details about each option, see Inspect traces.
- Time reference menu: Select one of the following to determine how
timing information for each call is measured (only supported in Sample/Trace
Java Methods):
- Wall clock time: Timing information represents actual elapsed time.
- Thread time: Timing information represents actual elapsed time minus any portion of that time when the thread is not consuming CPU resources. For any given call, its thread time is always less than or equal to its wall clock time. Using thread time gives you a better understanding of how much of a thread’s actual CPU usage is consumed by a given method or function.
-
Filter: Filters trace data by function, method, class, or package
name. For example, if you want to quickly identify trace data related to a
specific call, type the name in the search
field. In the Flame chart tab, call stacks
that include a call, package, or class that matches the search query are
emphasized. In the Top down and Bottom up tabs, those call
stacks are prioritized over other trace results. You can also enable the
following options by checking the appropriate box next to the search field:
- Regex: To include regular expressions in your search, use this option.
- Match case: If your search is case-sensitive, use this option.
- Zoom in: Press W or scroll the mouse wheel while holding Ctrl (Command on Mac).
- Zoom out: Press S or scroll the mouse wheel backward while holding Ctrl (Command on Mac).
- Pan left: Press A or drag mouse right while holding Space.
- Pan right: Press D or drag mouse left while holding Space.
- Expand or collapse a thread: Double-click the thread name or press Enter while a thread is selected.
Choose a recording configuration
Before you begin recording trace information, choose the appropriate recording configuration for the profiling information that you want to capture:
- Sample Java Methods: Captures your app’s call stack at frequent
intervals during your app’s Java-based code execution. The profiler compares
sets of captured data to derive timing and resource usage information about
your app’s Java-based code execution.
An inherent issue of sampled-based tracing is that if your app enters a method after a capture of the call stack and exits the method before the next capture, that method call is not logged by the profiler. If you are interested in tracing methods with such short lifecycles, you should use instrumented tracing.
- Trace Java Methods: Instruments your app at runtime to record a
timestamp at the beginning and end of each method call. Timestamps are
collected and compared to generate method tracing data, including timing
information and CPU usage.
Note that the overhead associated with instrumenting each method impacts runtime performance and may influence profiling data; this is even more noticeable for methods with relatively short lifecycles. Additionally, if your app executes a large number of methods in a short time, the profiler may quickly exceed its file size limit and may not be able to record any further tracing data.
- Sample C/C++ Functions: Captures sampled traces of your app’s native
threads. To use this configuration, you must deploy your app to a device
running Android 8.0 (API level 26) or higher.
Internally, this configuration uses
simpleperf
to trace your app's native code. If you want to specify additional options forsimpleperf
, such as sampling specific device CPUs or specifying sampling durations at a high accuracy, you can usesimpleperf
from the command line. - Trace System Calls: Captures fine-grained details that allow you to
inspect how your app interacts with system resources. You can inspect exact
timings and durations of your thread states, visualize where your CPU
bottlenecks are across all cores, and add custom trace events to analyze.
Such information can be crucial when you are troubleshooting performance
issues. To use this configuration, you must deploy your app to a device
running Android 7.0 (API level 24) or higher.
While using this trace configuration, you can visually mark important code routines in the profiler timeline by instrumenting your code. To instrument C/C++ code, use the native tracing API provided by
trace.h
. To instrument Java code, use theTrace
class. For more information, see Instrument your app code.This trace configuration is built on
systrace
. You can use thesystrace
command-line utility to specify options beyond those provided in the CPU Profiler. The additional system-level data provided bysystrace
can help you to inspect native system processes and troubleshoot dropped or delayed frames.On devices running Android 9 (API level 28) or higher, you can use a system app called System Tracing to record system traces on a device.
Create, edit, or view a recording configuration
You create, edit, and view recording configurations in the CPU Recording Configurations dialog, which you open by selecting Edit configurations from the recording configurations dropdown menu at the top of the CPU Profiler.
To view the settings of an existing recording configuration, select it in the left pane of the CPU Recording Configurations dialog.
To create a new recording configuration, do the following:
- Click Add at the top-left of the dialog. This creates a new configuration with some default settings.
- Name your configuration.
- Select a Trace Technology.
- For sampled recording configurations, specify the Sampling interval in microseconds (μs). This value represents the time between each sample of your app’s call stack. The shorter the interval you specify, the faster you reach the file size limit for the recorded data.
- Specify the File size limit, in megabytes (MB), for the recorded data
that’s written to the connected device. When you stop recording, Android
Studio parses this data and displays it in the profiler window. So, if you
increase the limit and record a large amount of data, Android Studio takes
much longer to parse the file and may become unresponsive.
Note: If you use a connected device running Android 8.0 (API level 26) or higher, there is no limit on the file size of the trace data, and this value is ignored. However, you still need to be careful about how much data the device collects after each recording—Android Studio may have difficulty parsing large trace files. For example, if you’re recording either a sampled trace with a short sampling interval or an instrumented trace while your app calls many methods in a short time, you’ll generate large trace files quickly.
- To accept the changes and continue making changes to other configurations, click Apply. To accept all applied changes and close the dialog, click OK.
Record CPU activity with the Debug API
You can use the Debug
API to give your app the
ability to start and stop the recording of CPU activity in the CPU Profiler.
The CPU Profiler begins recording when your app calls
startMethodTracing(String tracePath)
,
and the CPU Profiler stops recording when your app calls
stopMethodTracing()
. While
recording CPU activity that’s triggered using this API, the CPU profiler shows
Debug API as the active CPU recording configuration.
To control the recording of CPU activity with the Debug
API, deploy your
instrumented app to a device running Android 8.0 (API level 26) or higher.
API-initiated recording is supported in profileable apps, however Android Studio
profilers require a debuggable app to display the recording status in the UI.
Important: The
Debug
API is intended to be used
separately from other means for starting and stopping the recording of CPU
activity, such as the buttons in the CPU Profiler graphical user interface and
the setting in the recording configuration for automatic recording on app
startup.
Due to the buffer size limit of 8 MB, the
startMethodTracing(String tracePath)
method in the
Debug
API is designed for short intervals or scenarios that are
hard to start/stop recording manually. For longer periods of recording, use
the profiler UI in Android Studio.
For more information, see Generate trace logs by instrumenting your app.
Record CPU activity during app startup
To begin recording CPU activity automatically during app startup, do the following:
- Select Run > Edit Configurations.
- In the Profiling tab, check the box next to Start recording a method trace on startup.
- Select a CPU recording configuration from the menu.
- Click Apply.
- Deploy your app to a device running Android 8.0 (API level 26) or higher by selecting Run > Profile.