Call chart
Stay organized with collections
Save and categorize content based on your preferences.
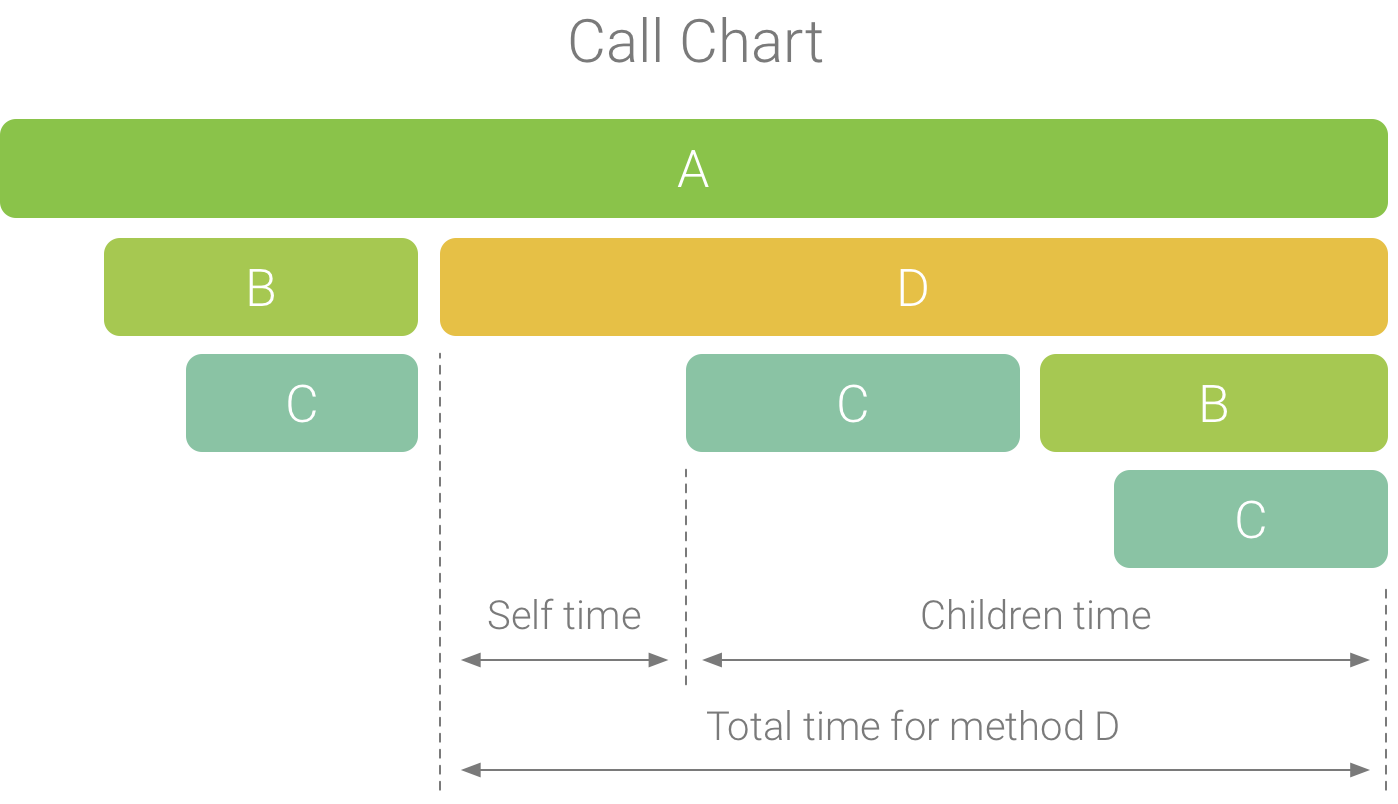
The call chart provides a graphical representation of a method trace or
function trace, where the period and timing of a call is represented on the
horizontal axis, and its callees are shown along the vertical axis. Calls to
system APIs are shown in orange, calls to your app's own methods are shown in
green, and calls to third-party APIs (including Java language APIs) are shown in
blue. Figure 1 shows an example call chart and illustrates the concept of self
time, children time, and total time for a given method or function. You can
learn more about these concepts in
Top-down and bottom-up charts.

Figure 1. An example call chart that illustrates
self, children, and total time for method D.
Content and code samples on this page are subject to the licenses described in the Content License. Java and OpenJDK are trademarks or registered trademarks of Oracle and/or its affiliates.
Last updated 2024-08-29 UTC.
[[["Easy to understand","easyToUnderstand","thumb-up"],["Solved my problem","solvedMyProblem","thumb-up"],["Other","otherUp","thumb-up"]],[["Missing the information I need","missingTheInformationINeed","thumb-down"],["Too complicated / too many steps","tooComplicatedTooManySteps","thumb-down"],["Out of date","outOfDate","thumb-down"],["Samples / code issue","samplesCodeIssue","thumb-down"],["Other","otherDown","thumb-down"]],["Last updated 2024-08-29 UTC."],[],[]]

